User Guide
Quickstart
The code below shows the example IRI calculation with the
iricore.iri() using the default set of JF parameters. The version
of IRI can be specified using a two-digit integer corresponding to the last
two digits of the IRI version. For example, vesion=16 corresponds to IRI-2016.
Currently, only IRI-2016 and IRI-2020 are supported. The default is IRI-2020 version.
import numpy as np
from iricore import iri
from datetime import datetime

# Specify the date and time in UTC
dt = datetime(2020, 4, 11, 10)
# Specify geographical coordinates in degrees
lat, lon = 45.5, -73.6
# Specify the altitude range as [start, stop, step] in km
altrange = [0, 1000, 10]

# Call the iricore.iri() and store the result in a variable
iri_out = iri(dt, altrange, lat, lon, version=20)

# The calculated electron density is stored in the 'edens' field
print(iri_out.edens[:20])
The printed output will be
[          nan           nan           nan           nan           nan
           nan           nan 4.1129428e+07 3.3051053e+08 2.8259692e+09
 1.1018275e+10 1.1512679e+10 9.0253507e+09 8.9702871e+09 1.1402358e+10
 2.5465129e+10 3.3002629e+10 4.0445055e+10 4.7959273e+10 5.5087657e+10]
Some of the values are np.nan because IRI could not estimate the electron density
at the corresponding height (usually very low altitudes during nighttime).
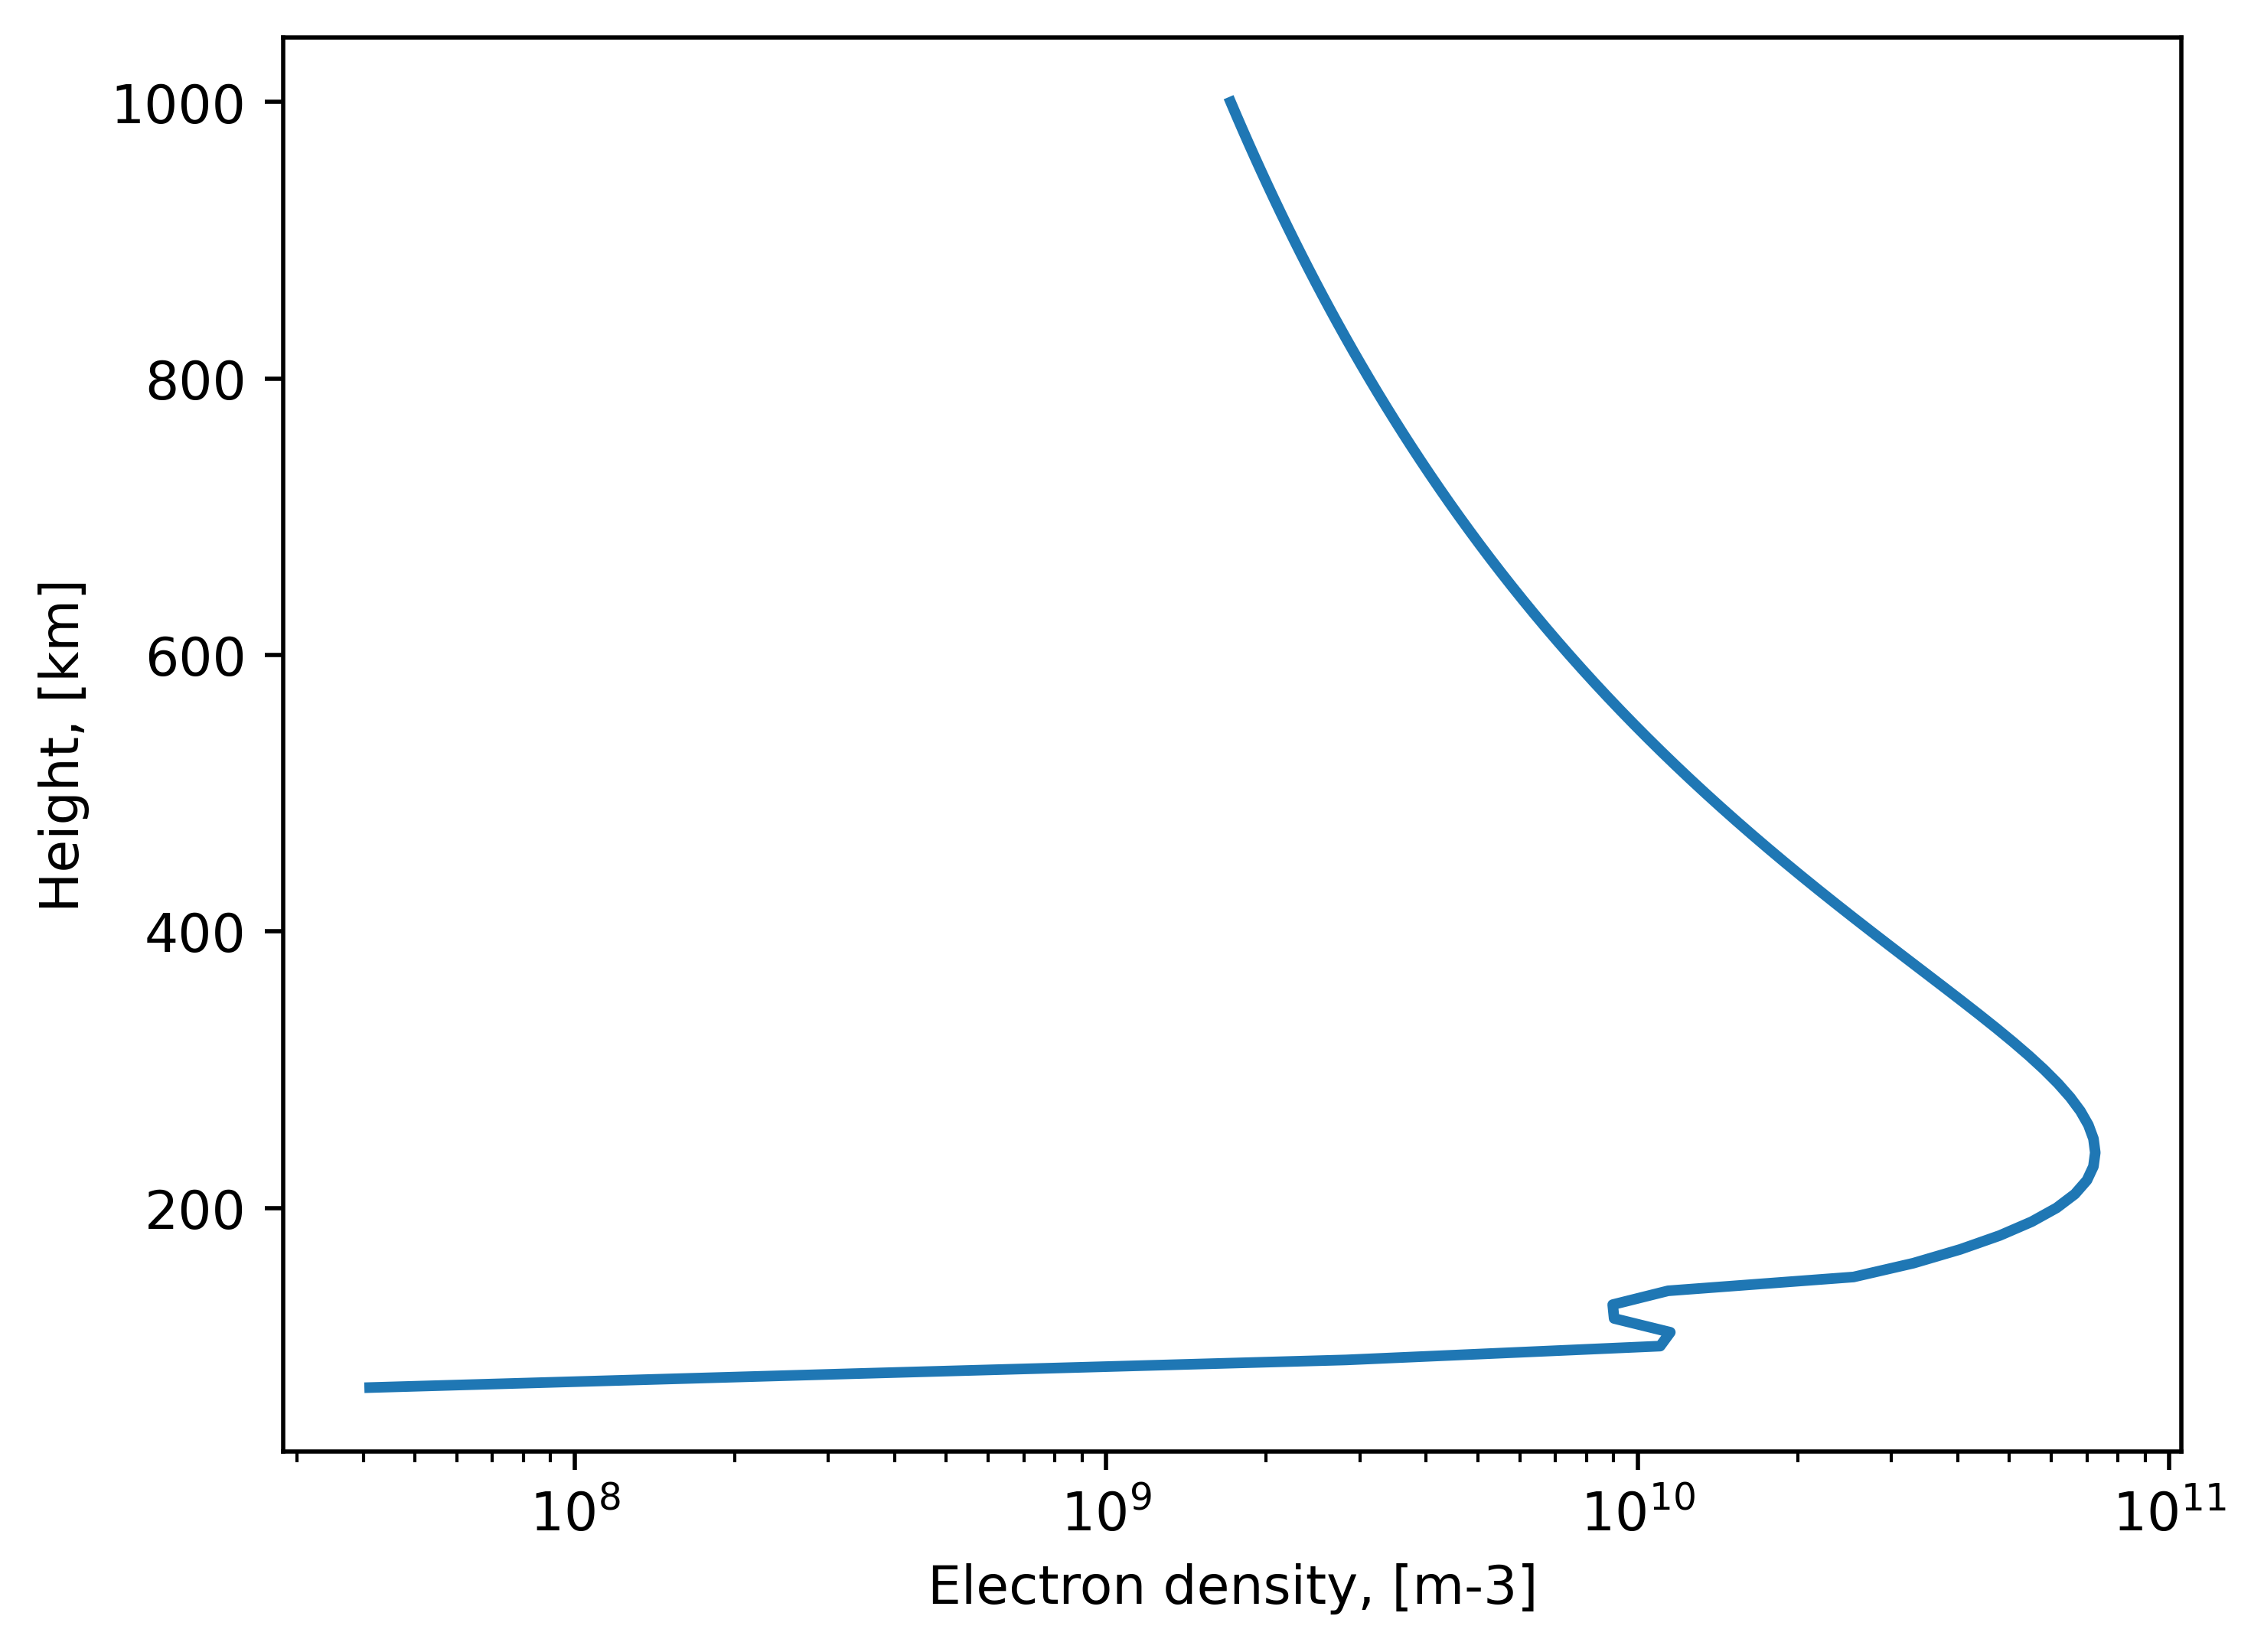
We can now plot the result:
import matplotlib.pyplot as plt

plt.semilogx(iri_out.edens, iri_out.height, lw=2)
plt.xlabel("Electron density, [m-3]")
plt.ylabel("Height, [km]")
plt.show()
Updating indices files
The apf107.dat and ig_rz.dat are frequently updated. Currently, iricore
does not autoupdate those. You can (an should) do it manually by calling the
iricore.update() function, especially if you are working in the
recent date range.
import iricore
iricore.update()
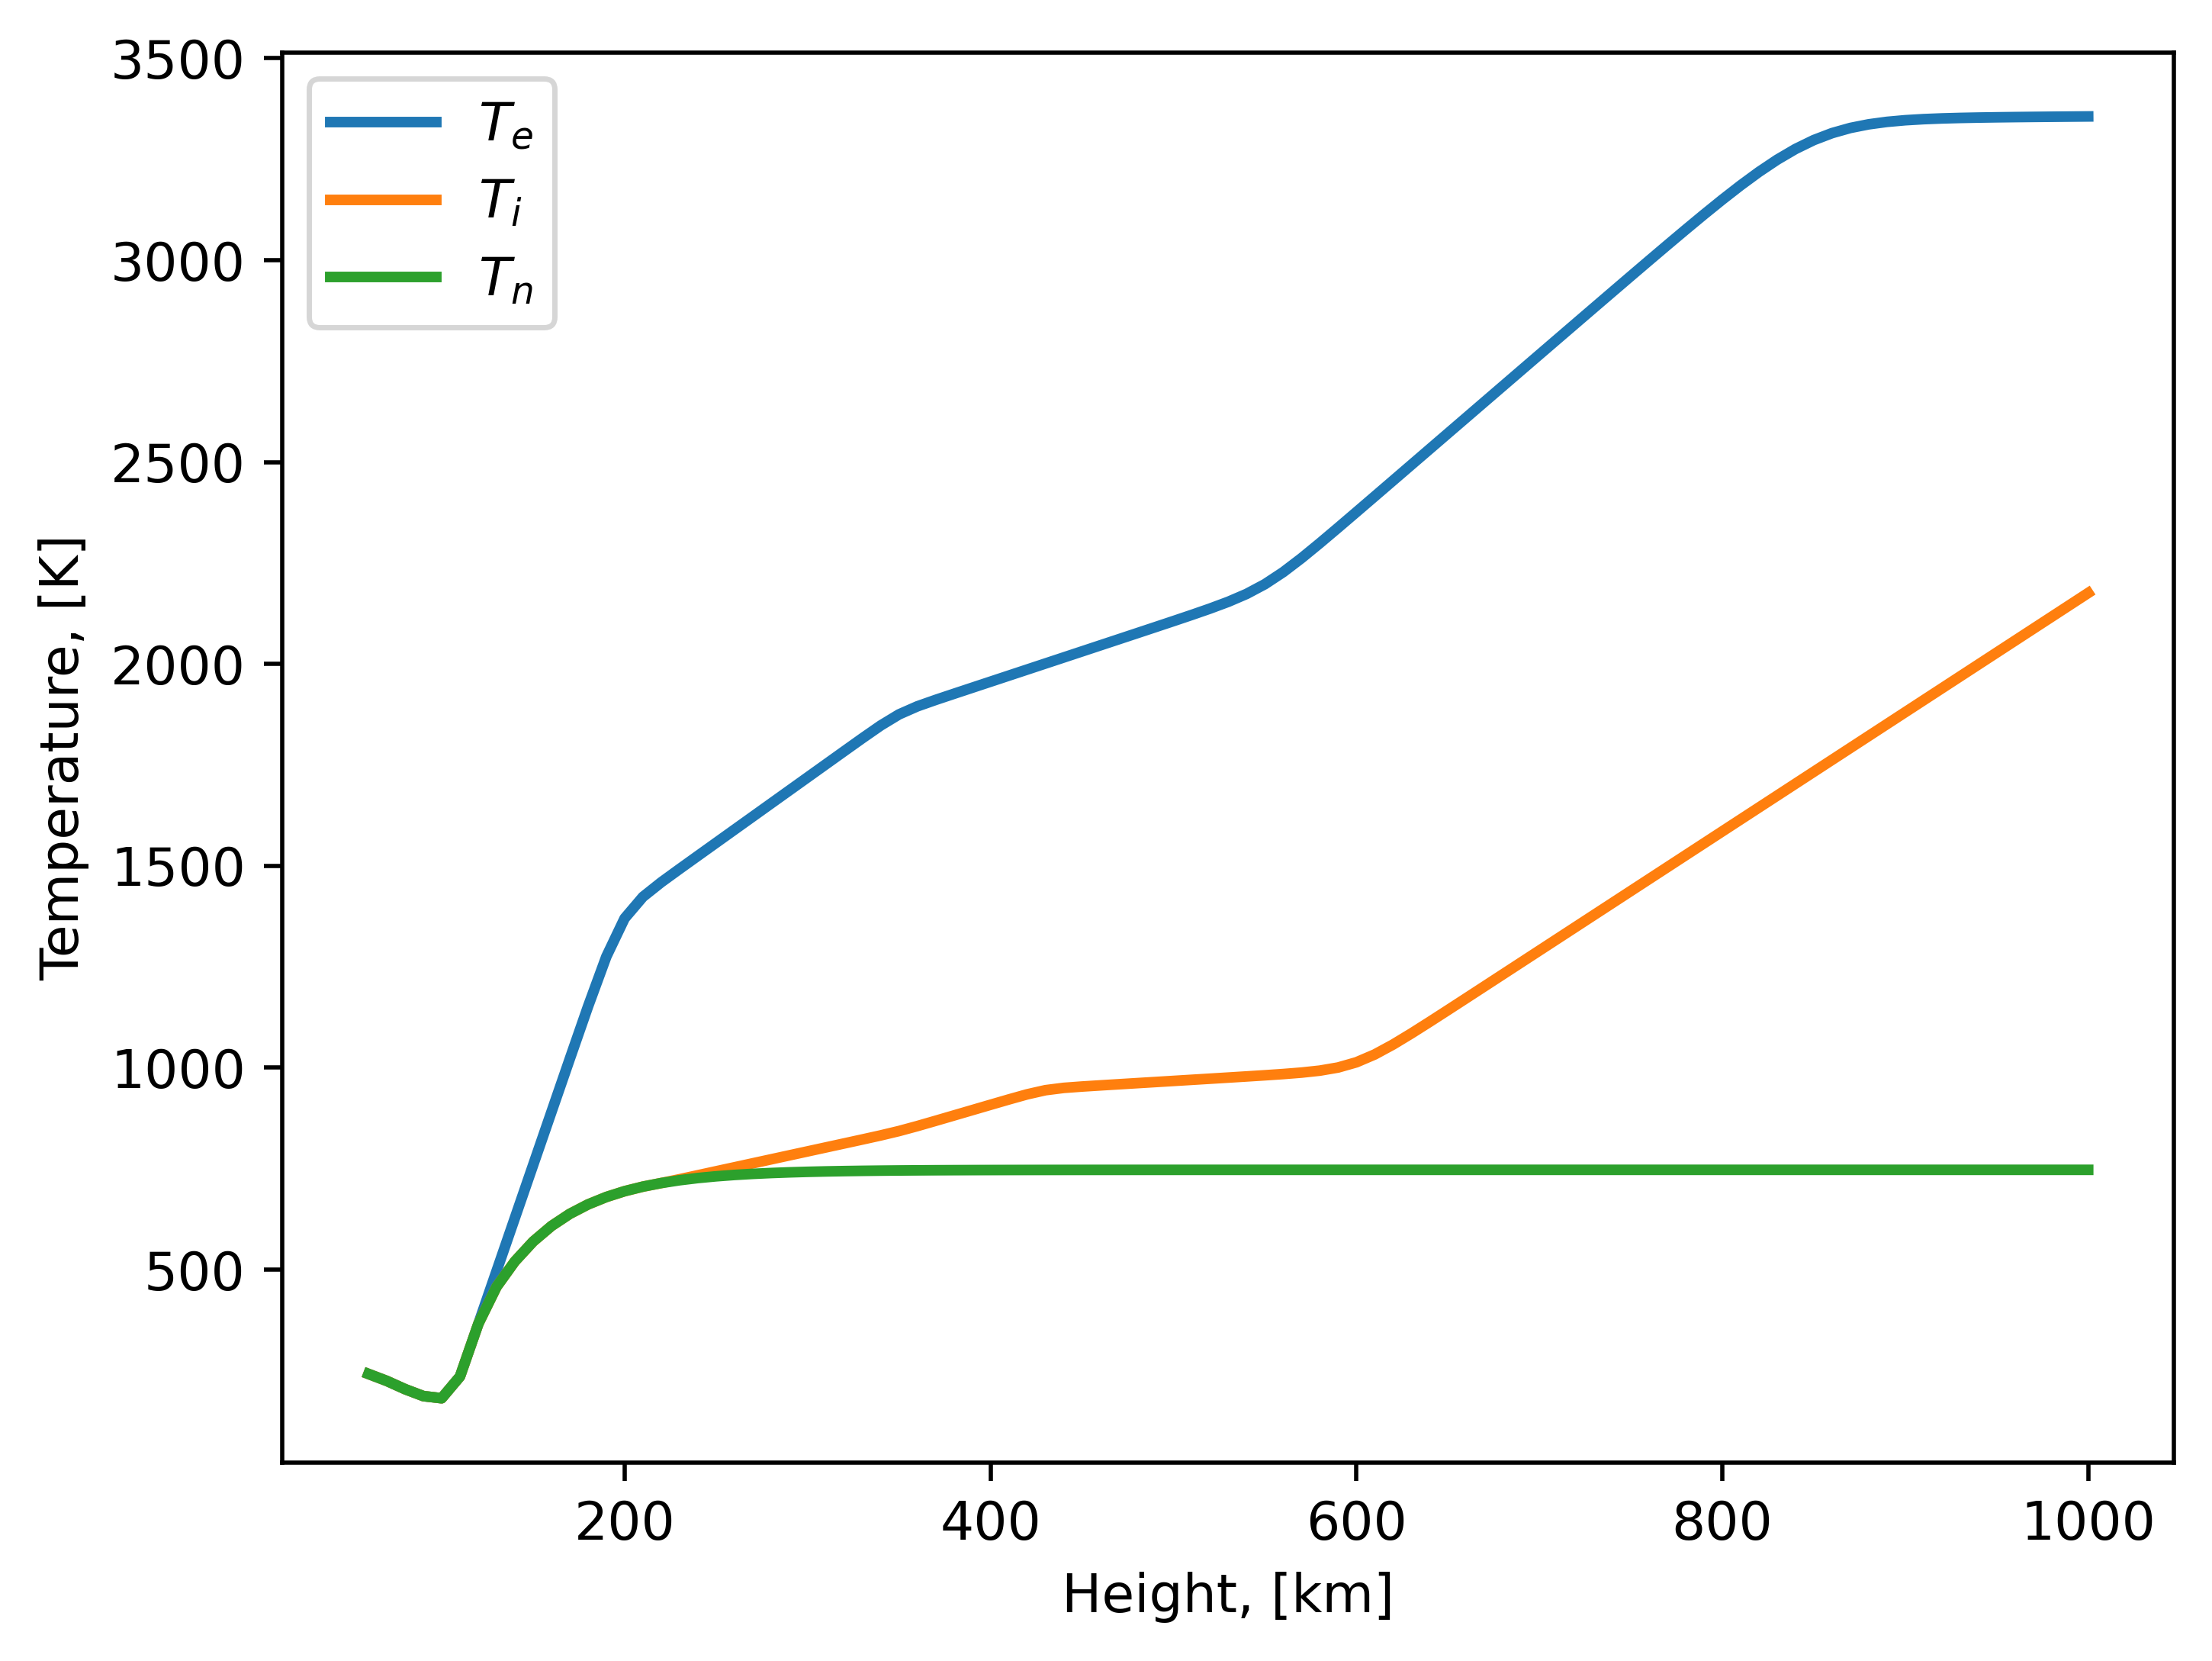
Temperatures and ion densities
If not specified otherwise, the neutral, ion and electron temperatures, as well as ion densities (O+, H+, He+, O2+, NO+, N+ and cluster ions) will be calculated together with the electron density.
Calculated temperatures can be accessed via ntemp, itemp and etemp
iricore.IRIOutput fields for neutral, ion and electron temperatures
accordingly:
from iricore import iri
from datetime import datetime

import matplotlib.pyplot as plt

dt = datetime(2020, 4, 11, 10)
lat, lon = 45.5, -73.6
altrange = [0, 1000, 10]

iri_out = iri(dt, altrange, lat, lon, version=20)

plt.plot(iri_out.height, iri_out.etemp, lw=2, label=r"$T_e$")
plt.plot(iri_out.height, iri_out.itemp, lw=2, label=r"$T_i$")
plt.plot(iri_out.height, iri_out.ntemp, lw=2, label=r"$T_n$")
plt.ylabel("Temperature, [K]")
plt.xlabel("Height, [km]")
plt.legend()
plt.show()
The ion density can be accessed through the o, h, he, o2, no, n and
cluster fields. By default, the output ion density is in percent scale:
plt.plot(iri_out.height, iri_out.o, lw=2, label="O+")
plt.plot(iri_out.height, iri_out.h, lw=2, label="H+")
plt.plot(iri_out.height, iri_out.he, lw=2, label="H+")
plt.plot(iri_out.height, iri_out.o2, lw=2, label="O2+")
plt.plot(iri_out.height, iri_out.no, lw=2, label=r"NO+")
plt.ylabel("Ion density, [%]")
plt.xlabel("Height, [km]")
plt.legend()
plt.show()

Slant TEC
The slant TEC calculation is available through the iricore.stec() function.
The sTEC is calculated by calculating the line-of-sight trajectory within defined height limits to
evaluate IRI and estimate electron density, which is then summed up. This routine is implemented on top of IRI, since
IRI provides only vertical TEC routine (see iricore.vtec()).
from iricore import stec
from datetime import datetime

dt = datetime(2020, 4, 11, 10)
# For stec() you must additionally specify the direction
# of the line-of-sight via elevation and azimuth in [deg]
el, az = 45, 190
lat, lon = 45.5, -73.6
altrange = [0, 1000, 10]

sTEC = stec(el, az, dt, lat, lon)
print(f"sTEC = {sTEC:.2f} TECU")
sTEC = 1.99 TECU
Vertical TEC
The iricore.vtec() function is not a copy of original TEC calculation implemented in the IRI.
The iricore.vtec() calculates and integrates electron density on a uniform grid with a given altitude step. Example:
from iricore import vtec
import numpy as np
from datetime import datetime

dt = datetime(2021, 4, 11, 10)
lat = np.linspace(0, 90, 10)
lon = np.linspace(0, 180, 10)

print(vtec(dt, lat, lon, hstep=0.5))
[26.093887  25.40059   54.395958  31.925163  14.804036
 10.436093,  8.083576   5.1865277  3.8248532  5.087081]
Manual JF input
The IRI model provides many possibilities for model customization through the JF array of parameters.
Most of these parameters (those that do not involve manual user input) are supported by iricore.
All iricore functions have the optional jf parameter which allows for manual JF input.
The easiest way to initialize the JF array is by calling the iricore.get_jf() function:
from iricore import get_jf
jf =get_jf()
The jf variable now contains an 1D numpy array of default IRI parameters. Next,
you can change any of them to your liking. For the full table of IRI parameters with explanations
see iricore.get_jf().
Note
Since Python follows zero-based array indexing (in contradistinction to one-based indexing in Fortran), all
indices of IRI parameters from the official IRI documentation must be reduced by 1 when used in iricore.
For instance, let’s the ion density output from percent to absolute values;
this requires setting jf[21] to False. Also, let’s use FIRI model for the D-layer, instead of
default one (the FIRI output will be stored in the IRIOutput.firi_output field - see Reference). For this, we
need to set jf[23] to False. When all settings are done, simply pass the jf to any iricore function:
from iricore import iri, get_jf
from datetime import datetime

# (coordinates and time definitions)

jf = get_jf()
jf[[21, 23]] = False
iri_out = iri(..., jf=jf)